Analytics will help you find out in a couple of clicks how and how much your managers correspond, and notice the increase or decrease in interest towards your product or service.
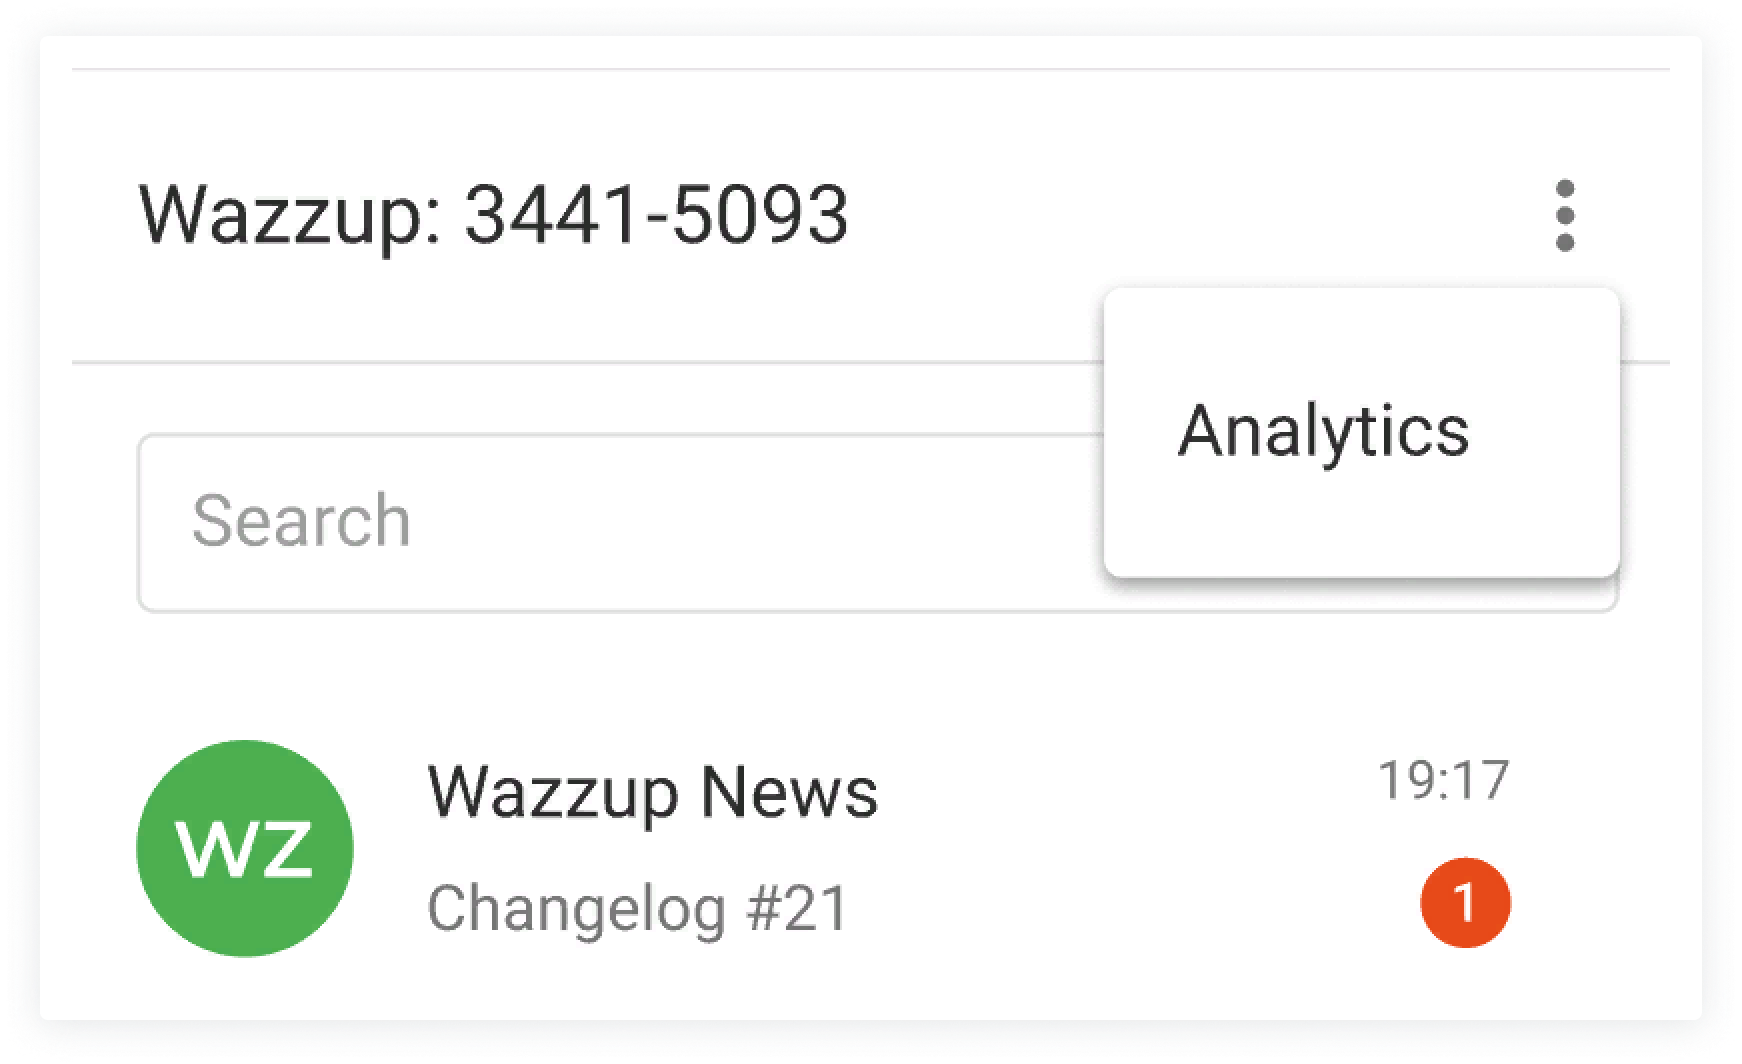
Everyone who has access to a personal account can see the data in the “Analytics” section. Also employees with the “Manager” role can use the analytics by clicking the ⋮ button in the window with all chats in CRM.
Analytics doesn’t show up in the mobile app or in the Wazzup chat, which is opened from the card in the CRM.

How to find out who among the salespeople answers for a long time
Go to the “By employee” tab → open the “Average response time” chart.
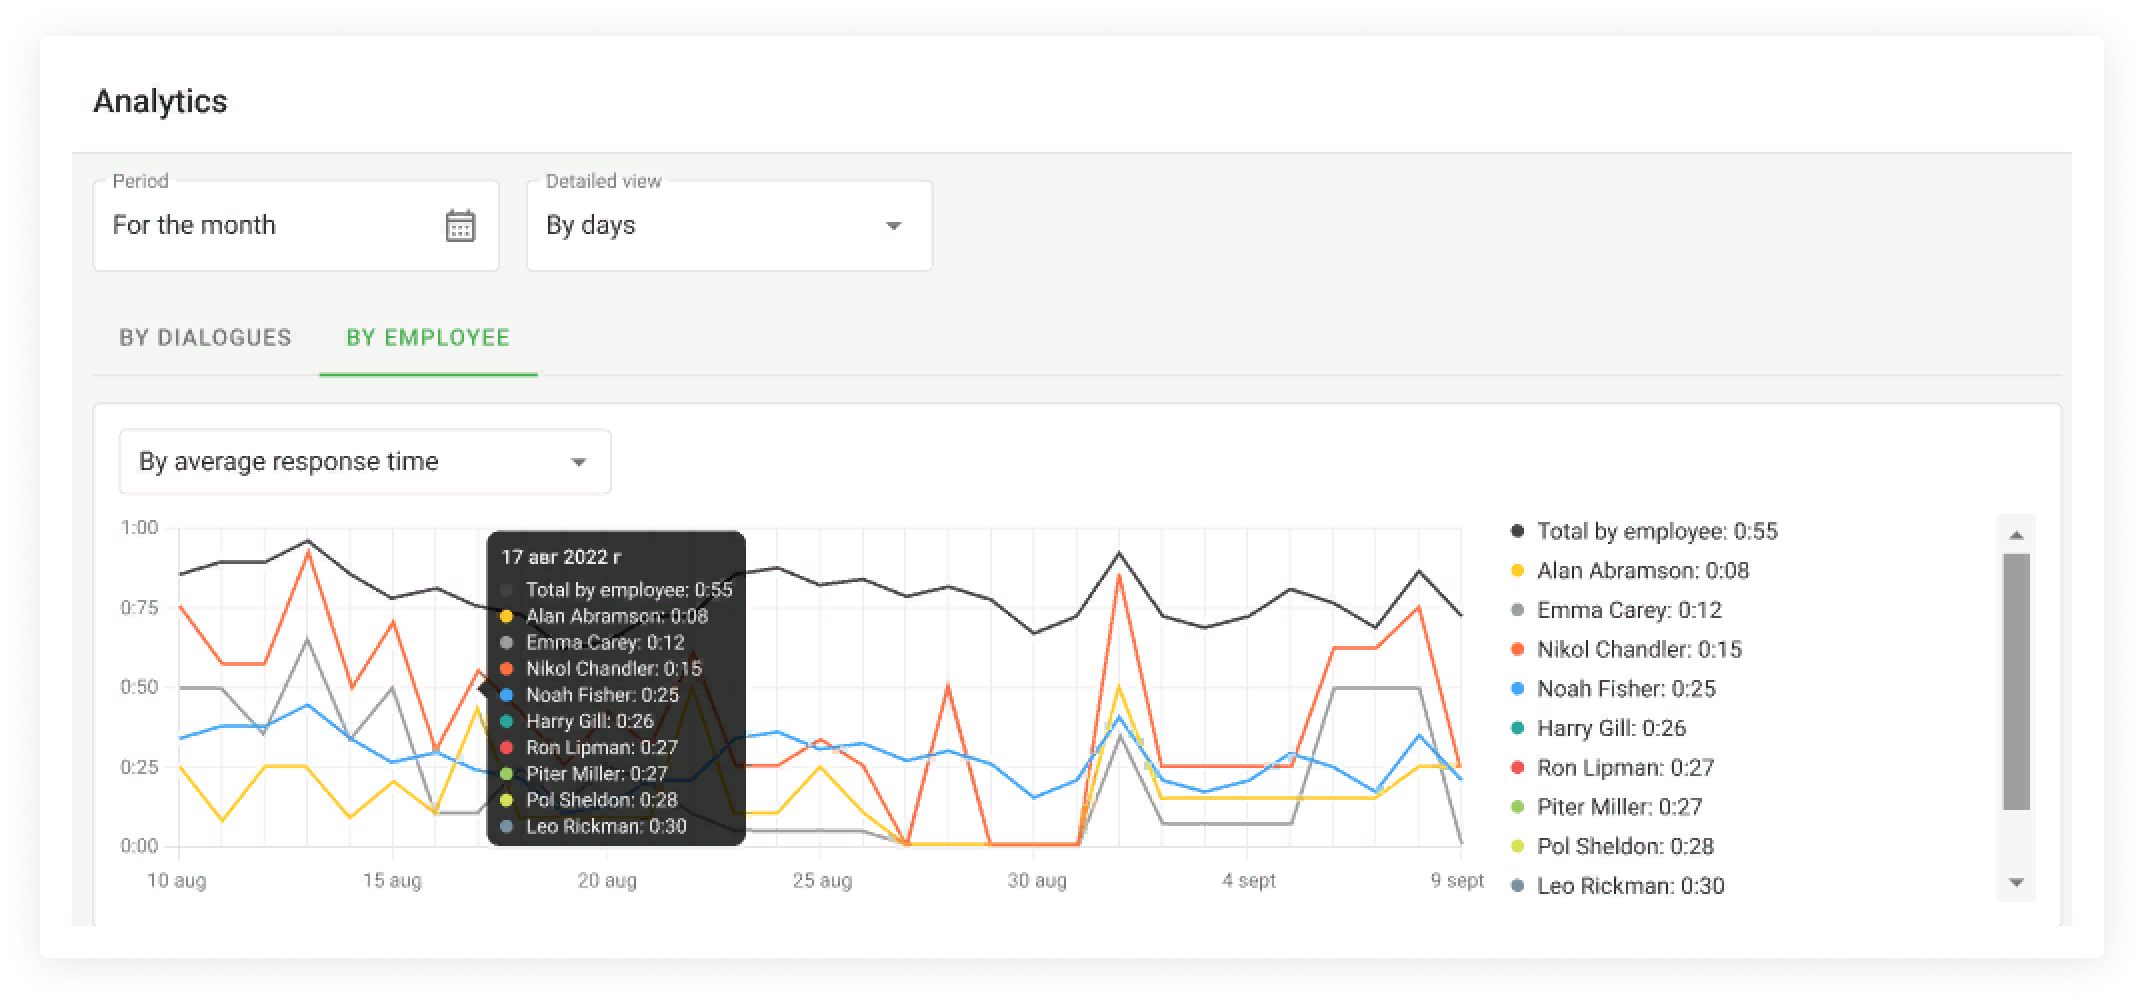
The average response time of all employees is an indicator of the service level in the sales department. The lower it is, the service is better and clients are happier.
The average response time of a particular employee is a reason to scold him or give the employee a premium.
How we calculate average response time
We record the time from the incoming message until the employee responsible for the deal, contact or lead responds or clicks the "envelope" button.
If there are several incoming messages from a customer, the response time counter starts from the first message.
In some cases the time is not recorded:
- if there is a responsible employee, but the person who is not responsible answered or pressed the "envelope" button;
- if the admin answered from a private account;
- if the answer was given not from Wazzup, but directly in a messenger;
- if automation from CRM worked.
If auto-reply "Missed call" or "First incoming" is triggered - time continues to run until a manager responds to the message.
If autoresponse "Off Time" is enabled — the response time counter will start only with the beginning of the working day.
When the average response time has become more than 8 hours, only ">8 hours" will be displayed in the charts, it will not grow further. Because if the client is ignored for a whole day, it is clear that everything is bad.
If the graph shows that the average time of the salesman has increased or decreased, you can figure out what’s wrong: look at the number of messages and dialogs of the employee.
Let’s say that yesterday the ratio between Valera’s average response time, the number of messages, and the number of dialogs was as follows:

And today it became this:

The number of messages, dialogs, and average response time has increased. Apparently, Valera is too busy, and therefore does not meet the deadline.
If the response time is growing by itself, perhaps the salesman is fooling around in the workplace. Or may be busy with other duties. It’s worth checking out what’s going on there.
It may be that a salesperson’s average response time is 0. This means that he has either not yet communicated with customers at all, or has written to them, but has not yet received a response. If the employee systematically ignores clients the response time will be >8 hours.
How to make sure a salesperson really corresponds with customers
To do this, you need to compare two analytics in the “By employee” tab: by messages and by dialogs.
The analytics in the table will help you to notice the strangeness in the correspondence and understand whose work is worth paying attention to.

If the seller has few dialogues, but a lot of messages
Either the customers ask a lot of questions, or the salesperson is flubbing.
The second creates the impression of active work for the manager and pisses off the client. It’s not very pleasant to get 100 messages in a row with only a couple of words in them. Check the correspondence just in case.
For example, when in a day the manager Valera sent 178 messages in one conversation it is weird. What did he chat about so much with the client? The manager should read the correspondence.
If a salesperson has a lot of dialogs, but few messages
It’s fine if salespeople make appointments or calls on messengers, and discuss all the details verbally.
But if you’re selling mostly in text messages, those statistics look suspicious. Either the employee is a great salesperson, so customers buy quickly, or the salesperson ignores messages, doesn’t lead the person to purchase.
When Alex has 19 messages in 15 conversations, maybe Alex is just ignoring clients.
How to find out when and why interest in a product grows
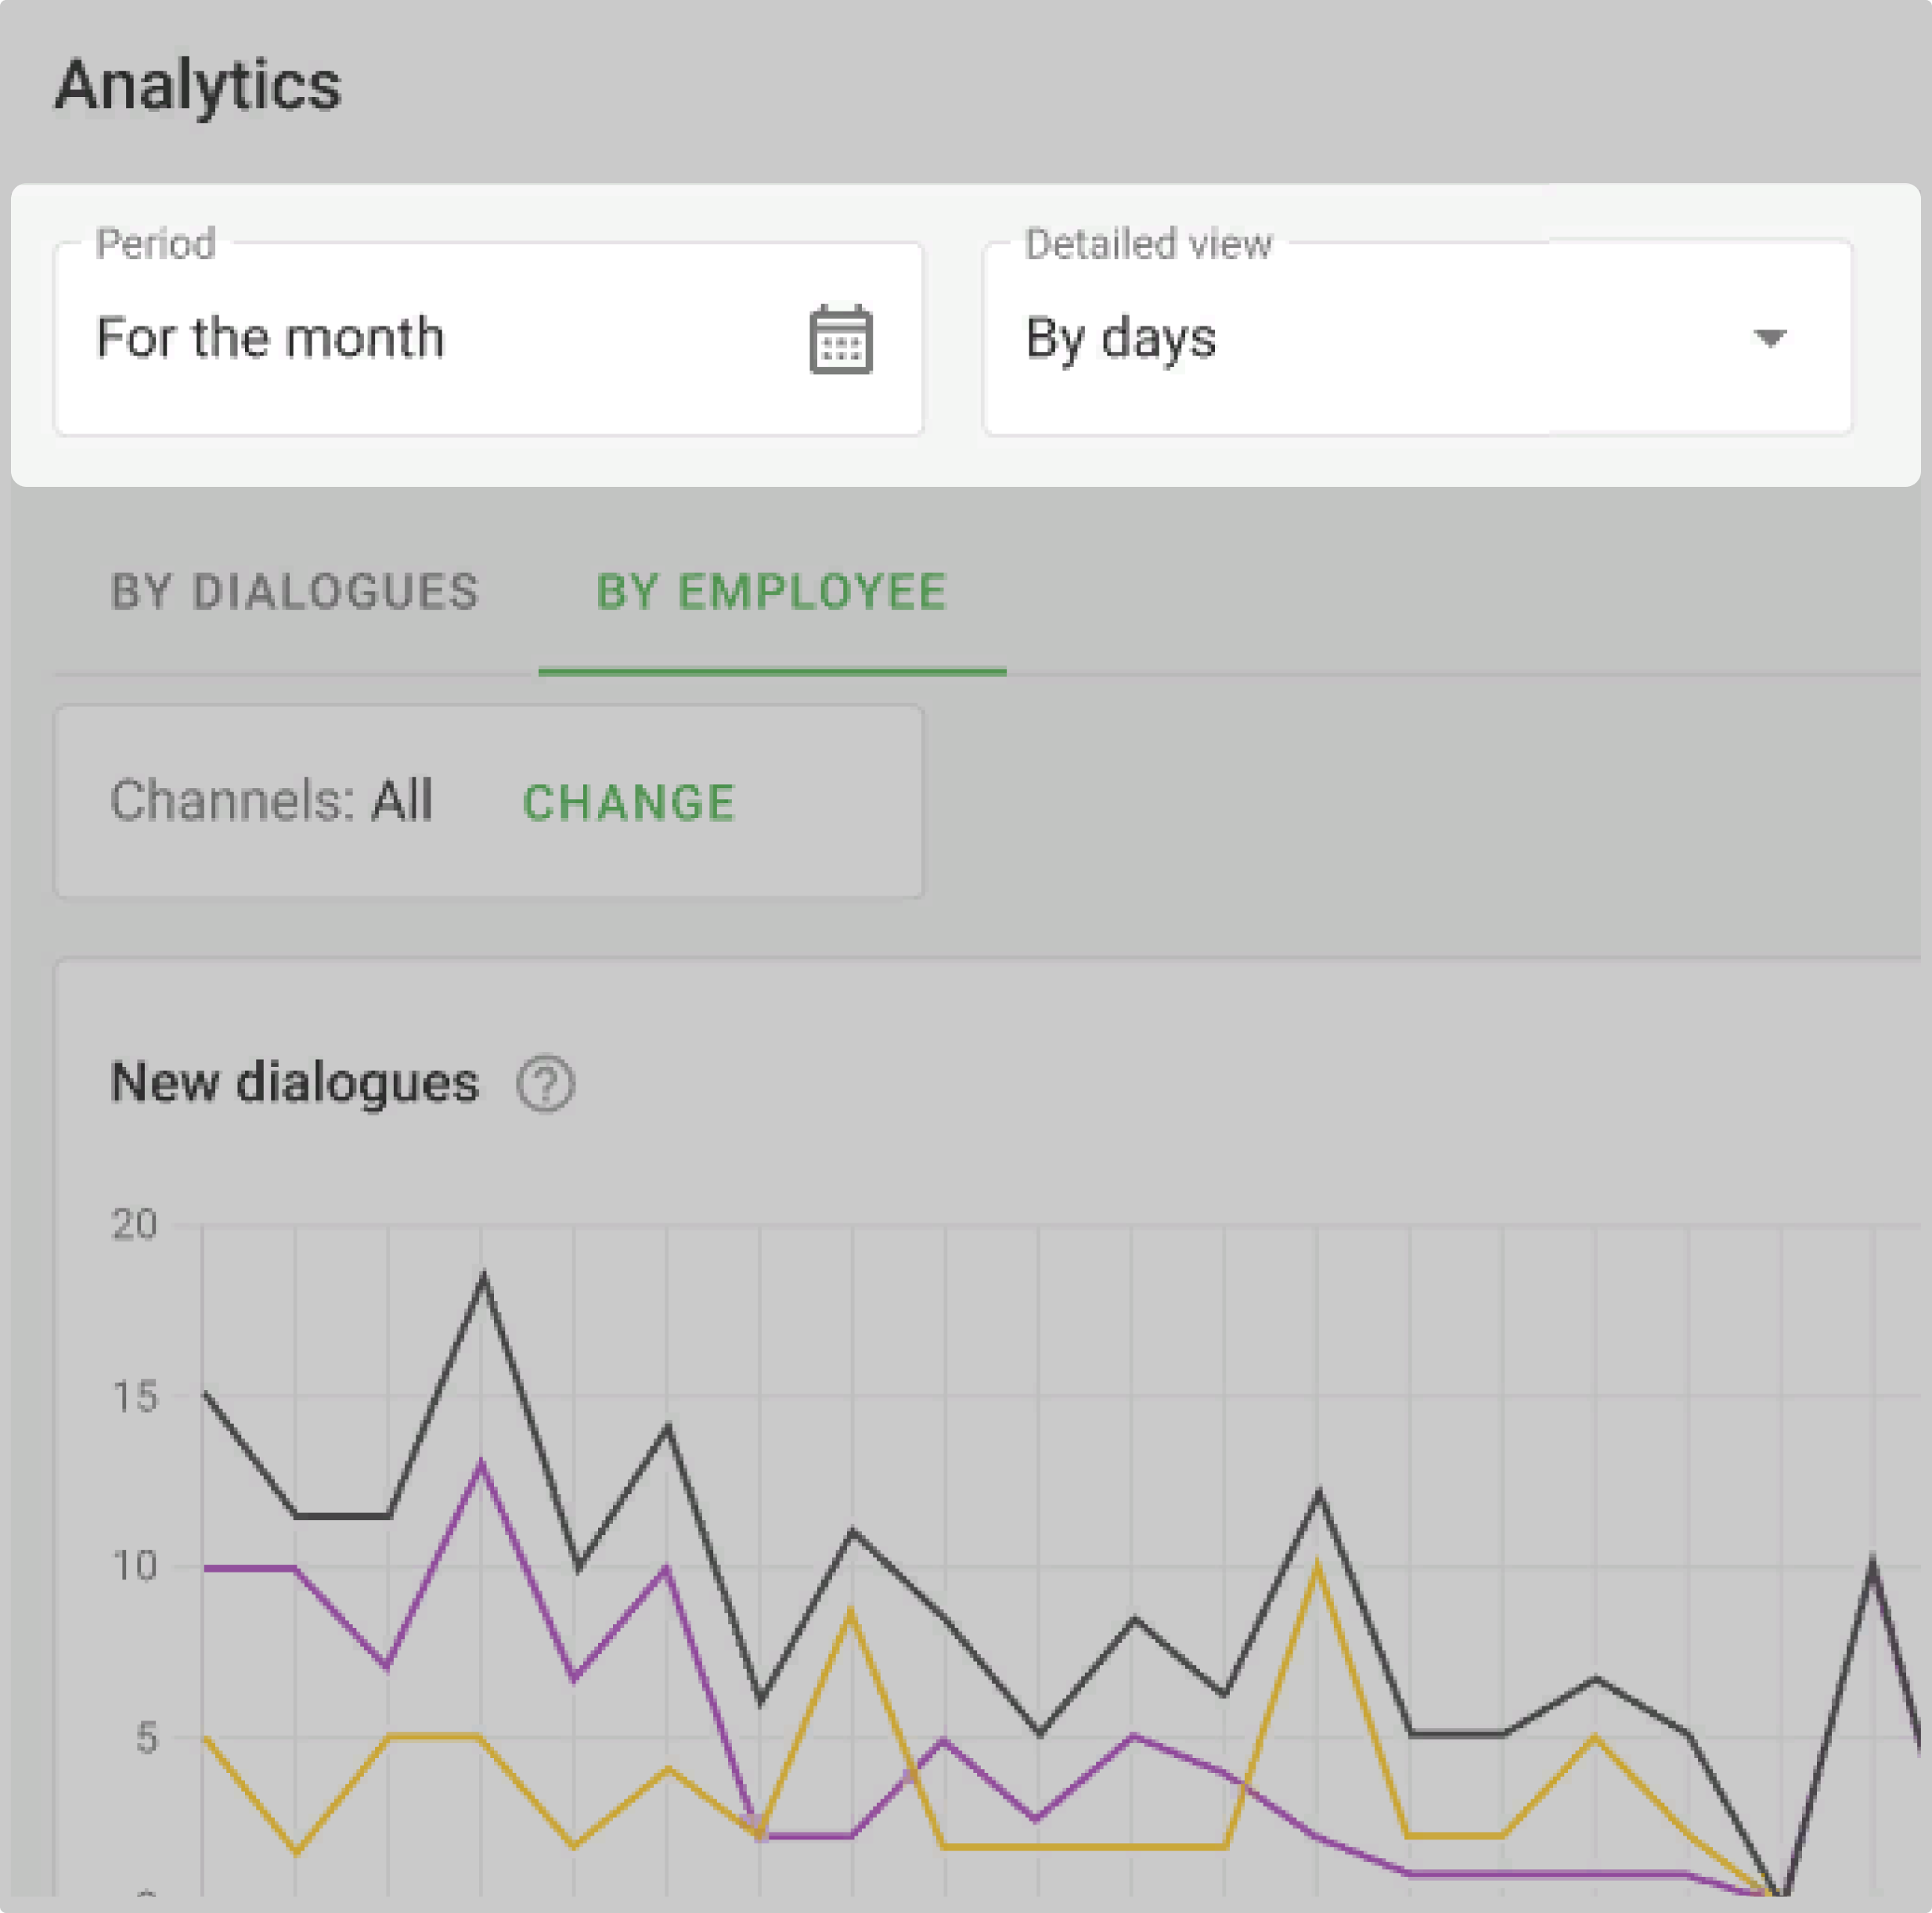
Interest in your product or service is reflected in the “New Dialogs” chart on the “By Dialogs” tab.

Here you can see how many clients wrote first on a particular day or period. Dialogs that were created manually or automatically get here. Only dialogs that have not contained messages before are counted.
If managers write first to clients who have left a request, then the number of dialogs started by the salesperson can also be taken into account.
Look for a correlation between the number of new dialogs and your actions affecting that number.
If the chart is growing
If you noticed a sudden flood of messages from clients last Wednesday, see what might have influenced it: a successful social media post or a radio ad, for example. Maybe this successful move can be repeated to attract more customers.
If the chart is falling
If you find that message traffic is always lower on Fridays, maybe your Friday needs some kind of promotion or advertisement. But only if the dramatic drop in customer requests is a problem and needs to be addressed.
FAQ
How to see stats for last week, a specific day, or other period
Above the graphs you can select different periods to display the statistics - day, week, month. If necessary you can see the statistics for a specific period, even for three specific days in November, or for six weeks at the beginning of the year.
We collect data only from January 5, 2023, we don't collect statistics for the previous days.
Why there are no statistics until January 5, 2023
On this day, we have a section "Analytics". So far, statistics have not been collected.
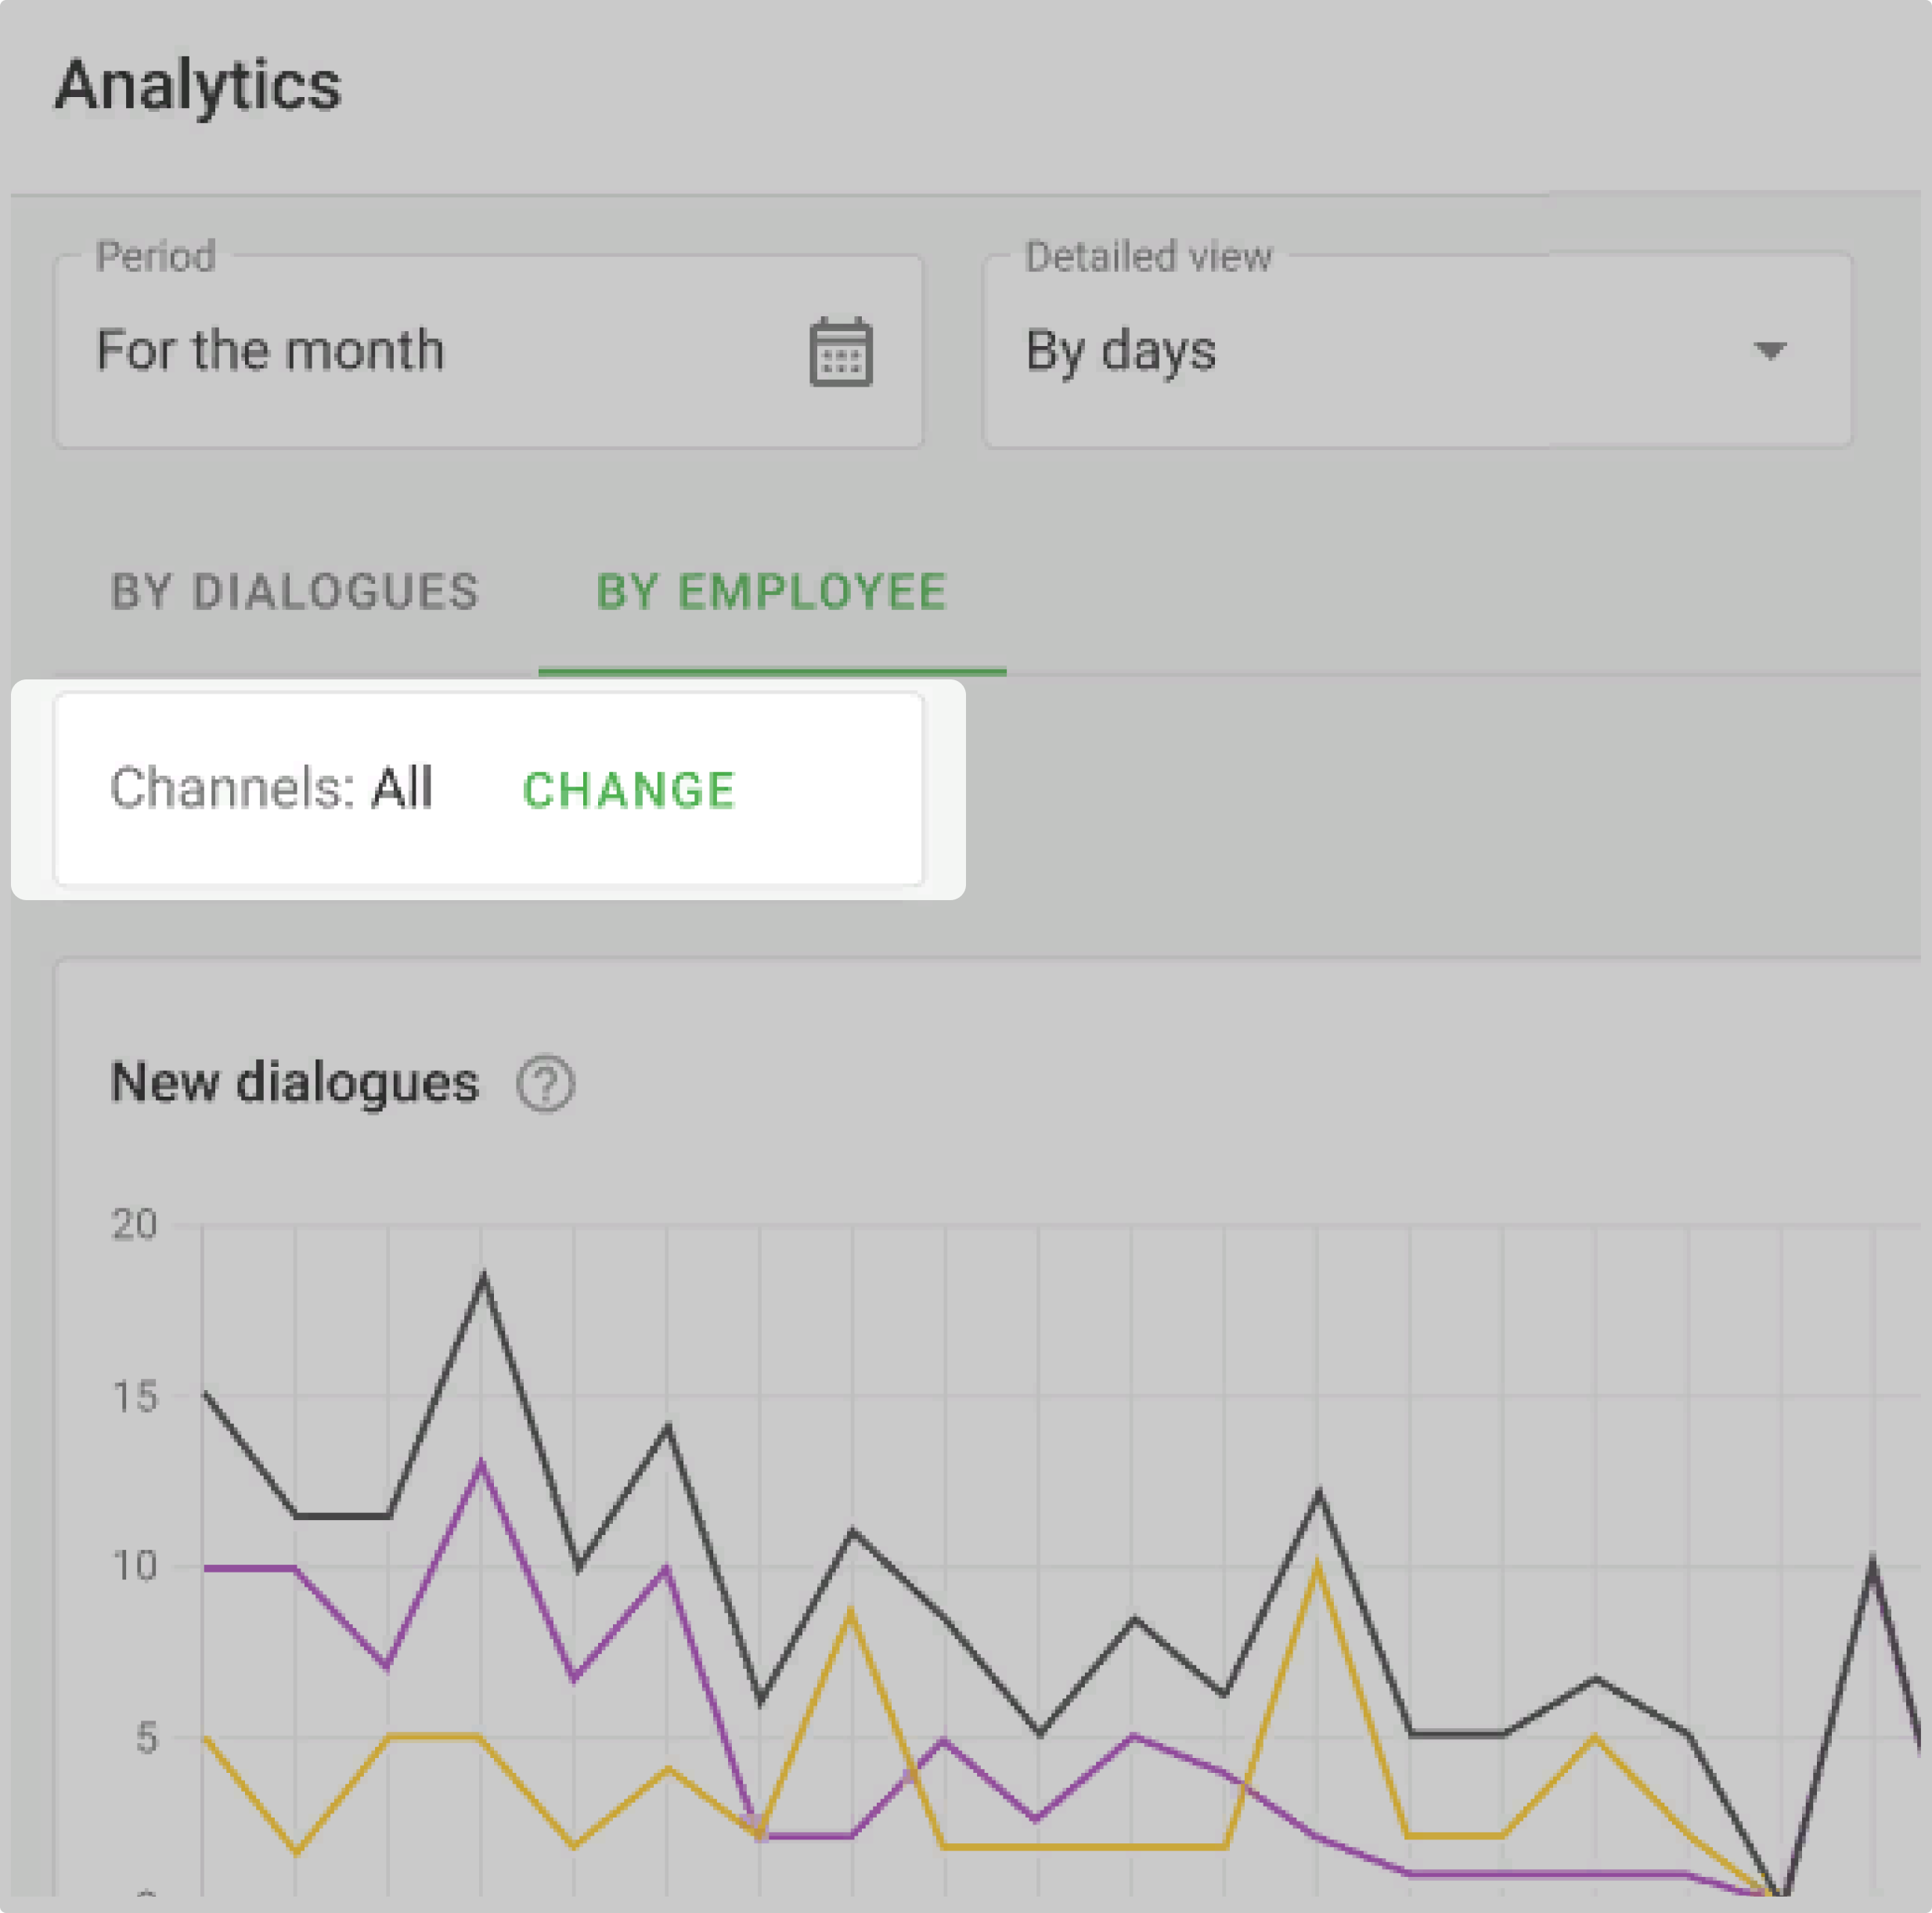
How to view statistics for a specific channel
You can view statistics by channels only in the "By dialogues" tab. To do this, click on the "Edit" button on the "Channels" panel and specify the required ones.
How to make statistics available to salespeople
Employees with the "Manager" role can view the statistics. If you want salespeople to keep track of their results, you can give them this role. But remember: then the employee will see all chats of the sales department, not just those for which he/she is responsible. And all the statistics will be available to him, not personal ones.